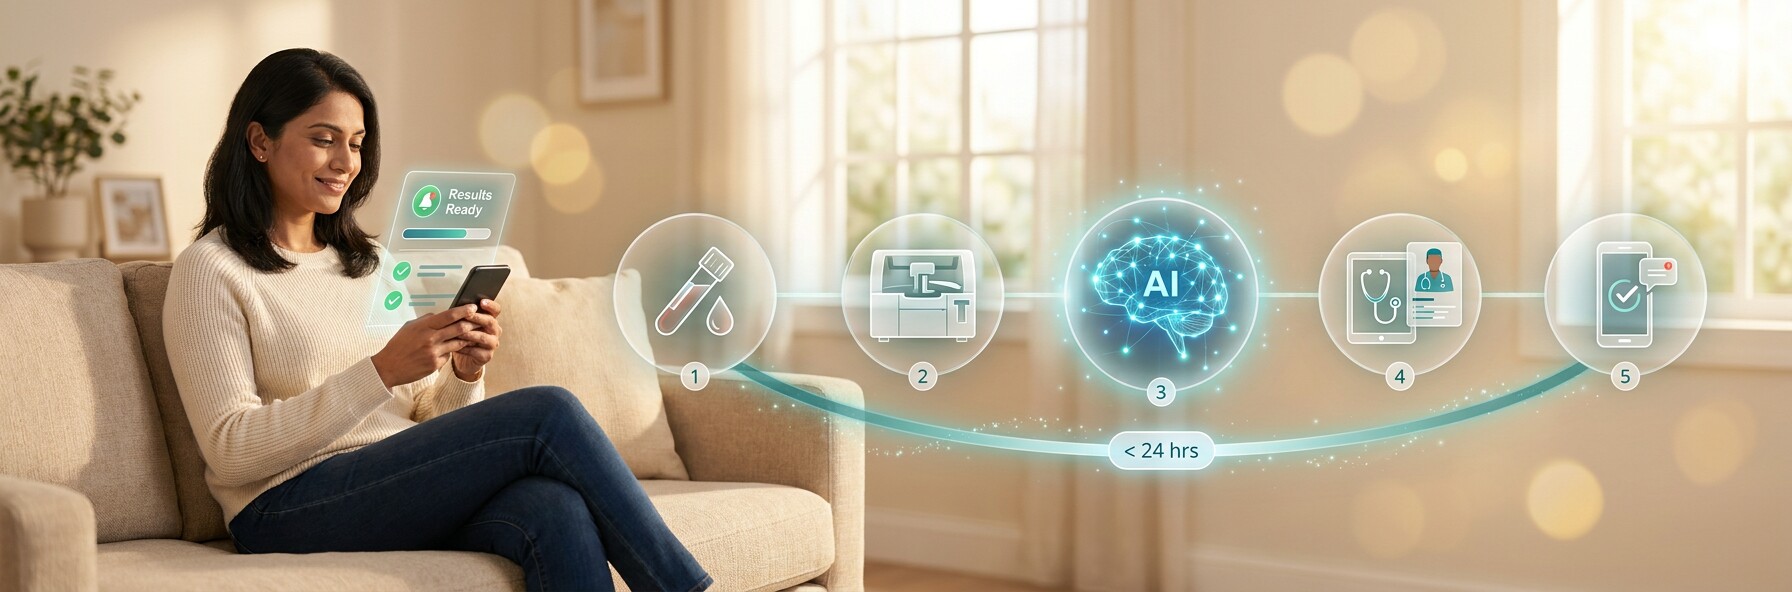
The Morning Blood Draw
It is 8:14 AM on a Tuesday. Priya, a 35-year-old schoolteacher in a suburb of Chennai, walks into a sample collection center two minutes from her home. Her LivoRx physician ordered a panel during their telehealth visit the evening before: complete blood count, HbA1c, lipid panel, thyroid-stimulating hormone, 25-hydroxyvitamin D, and fasting glucose. She is fasting, as instructed. The phlebotomist draws four vials. Priya is out the door in nine minutes.
At 7:43 PM — eleven hours and twenty-nine minutes later — her phone vibrates. A push notification: "Your lab results are ready. Your care team has reviewed them and has a message for you."
She opens the app. The layout is nothing like the patient portal she used at her previous clinic, where results arrived as a wall of reference ranges and cryptic abbreviations that sent her down a two-hour WebMD spiral every time. Here: a clean result card for each test, color-coded green-yellow-red, with a one-sentence plain-language description beneath each value. Her Vitamin D: low (flagged yellow, but not urgently so). Her fasting glucose: 98 mg/dL, normal range. Her HbA1c: 6.1%.
The HbA1c card is flagged yellow with a small "↑" trend indicator. Beneath it: "Your HbA1c has risen from 5.7% six months ago to 6.1% today. This places you in the pre-diabetic range. No medication is required at this stage, but this trend warrants attention." Below that, a note from her doctor: dietary recommendations, a referral to a diabetes prevention program, and a follow-up appointment already scheduled for three months out. One tap to confirm. One secure message to her doctor to ask a clarifying question about sugar substitutes. Done.
Total time from blood draw to actionable, physician-reviewed, personalized insight: 11 hours 29 minutes. The anxiety window — that suspended, helpless period between getting tested and knowing what the test means — compressed from the industry-standard three to five days down to the same afternoon. This is not a pilot. This is the production system we run today. And understanding how it works requires understanding why the standard lab result experience is, for most patients, fundamentally broken.
Why Lab Results Are Still a Black Box
The modern lab workflow has a design problem hiding in plain sight. A physician orders a test during a visit. The order is transmitted to a lab. The patient goes to a collection center. The sample is analyzed. The result is transmitted back to the ordering physician's electronic health record. The physician sees the result when they next log in — which might be between patients, at the end of the clinic day, or the following morning. Then someone — a nurse, a medical assistant, or the physician themselves — calls the patient or uploads the result to the patient portal.
Each of those handoffs carries latency. Each one can drop the baton. A 2009 study by Casalino and colleagues published in JAMA found that 7.1% of physicians reported failing to notify patients of clinically significant outpatient test results within a reasonable timeframe — not from negligence, but from the structural failure of a system with no end-to-end accountability. A 2021 systematic review in BMJ Quality & Safety found that 37% of abnormal results were not acknowledged by the ordering provider within seven days of transmission.
For telehealth specifically, the problem is compounded. In a physical clinic, a nurse notices an abnormal result in the morning inbox, pulls the chart, and calls the patient before noon. In telehealth, there is no physical inbox, no front-desk nurse who knows the patient, no ambient culture of "someone will follow up." There is an EHR notification that competes with a hundred others in a provider's digital workflow. The patient receives a portal notification that unlocks a PDF of raw values alongside reference ranges written for a laboratory auditor, not a human being.
"A patient who sees HbA1c: 6.1% (Reference: 4.0–5.6%) is not informed. They are handed raw material and expected to synthesize it into clinical understanding on their own. That is not healthcare — it is data delivery."
The insight gap — the distance between a result arriving and a patient understanding what it means for their life — is where patient anxiety festers, where follow-up intentions decay, and where the clinical value of ordering a test is quietly lost.
The Full-Loop Architecture: Five Stages from Order to Insight
Closing the insight gap requires re-engineering the entire chain — not patching any single step. Our full-loop architecture connects five discrete stages, each with a specific input, output, latency target, and quality gate. Here is how they work.
Lab Order Dispatch via FHIR ServiceRequest
LOINC-coded order transmitted to integrated lab networks within 5 minutes of physician approval. Patient receives same-day collection appointment and preparation instructions.
Latency target: <5 minutesResult Ingestion & Normalization
Lab result received via HL7 v2 ORU^R01 or FHIR DiagnosticReport, mapped to a normalized FHIR R5 Observation bundle with unit conversion and LOINC canonical mapping.
Latency target: <30 seconds from lab transmissionAI Panel Intelligence
Three analytical lenses: individual flag analysis with population-adjusted reference ranges, cross-panel pattern recognition, and longitudinal delta analysis against prior results.
Latency target: <2 minutes for most panelsClinical Safety Layer & Physician Review
AI output enters priority-ranked physician queue. No insight reaches the patient without physician gate. Urgent values trigger immediate on-call notification. Routine results cleared by next available provider session.
Latency target: <8 hours routine, immediate for critical valuesLast-Mile Patient Delivery
Push notification triggers plain-language result view with color-coded analytes, trend indicators, physician note, and pre-scheduled follow-up. Secure message channel open for patient questions.
Latency target: <60 seconds from physician approval to patient notificationStage 1: Lab Order Dispatch via FHIR ServiceRequest
When a physician orders labs during a telehealth visit, the platform generates a FHIR R5 ServiceRequest resource encoding the ordered panel in LOINC — the universal vocabulary for laboratory observations. A CBC becomes LOINC 58410-2 (CBC panel). HbA1c becomes LOINC 4548-4. Each code carries the ordered test, the patient identifier, the ordering provider NPI, the priority level, and routing metadata that determines which lab network receives the order.
We integrate with major lab networks in India (Thyrocare, Redcliffe Labs, SRL Diagnostics, Metropolis) and the United States (Quest Diagnostics, LabCorp, BioReference) via FHIR API where available, and via HL7 v2.5 ADT/ORM messaging for partners not yet FHIR-ready. The practical reality: only about 40% of Indian lab partners currently support FHIR API integration. For the rest, we maintain a translation layer that converts FHIR ServiceRequest into the correct HL7 v2 ORM^O01 message format that the partner's LIS (Laboratory Information System) accepts. This isn't technically glamorous, but it is the kind of integration that determines whether the system works in the real world.
Within five minutes of physician sign-off, the patient receives a confirmation: their order has been placed, here are the collection centers nearest to them, here is which tests require fasting and for how long. For most Indian metro areas, same-day morning collection with same-day results is achievable for routine chemistry panels on modern automated analyzers.
Stage 2: Result Ingestion and Normalization
Results return from the lab in whatever format the lab's LIS generates. This is where the normalization challenge becomes visceral. Consider HbA1c alone: it can arrive as a percentage (6.1%), as mmol/mol (43 mmol/mol, the IFCC unit used by most European and South Asian labs reporting to international standards), or as an estimated average glucose (eAG: 128 mg/dL). These are the same underlying measurement. Our normalization engine maps each to a canonical FHIR Observation with the correct UCUM unit code, the correct LOINC code, and a conversion applied where needed.
The unit problem extends to creatinine (mg/dL in the US, µmol/L in most of Asia), hemoglobin (g/dL universally, but decimal conventions differ), and glucose (mg/dL in the US, mmol/L in most other countries). A patient whose glucose arrives as 5.4 mmol/L is normal. A system that reads that as 5.4 mg/dL without unit awareness would classify it as critically low. We maintain a LOINC-to-unit mapping table covering 450+ lab-specific code variants, updated quarterly as lab partners update their LIS configurations.
The output of Stage 2 is a normalized FHIR R5 DiagnosticReport containing a bundle of Observation resources — one per analyte — each carrying: the canonical LOINC code, the numeric result, the UCUM unit, the observation status (final, preliminary, corrected), the specimen collection timestamp, and the lab's own reference range (preserved, not overwritten — we augment it, never replace it).
Stage 3: AI Panel Intelligence
The normalized Observation bundle enters the AI analysis layer, which views the results through three lenses simultaneously — and this triplicity is what separates clinical intelligence from a colored reference range table.
Individual flag analysis. Each analyte is evaluated against population-adjusted reference ranges, not just the lab's default ranges. The lab's HbA1c reference range of "4.0–5.6%" makes no distinction between a 28-year-old athletic woman and a 65-year-old man with a history of pre-diabetes. Our reference range module incorporates age, sex, and population group adjustments drawn from peer-reviewed normative data, and where evidence supports it, population-specific thresholds (more on this in the next section).
Cross-panel pattern recognition. This is the analytical layer that catches what individual flags miss. A TSH of 4.8 mIU/L sits just inside the standard reference range of 0.4–4.5 mIU/L — many labs would report it as normal. But if the same panel shows a free T4 trending downward from 1.1 to 0.9 ng/dL, the patient mentions fatigue in recent visit notes, and total cholesterol has risen 18 points in six months — that constellation is a subclinical hypothyroidism pattern, not a collection of individually borderline values. The pattern recognition model has learned over 200 clinically validated multi-analyte patterns from a curated training corpus, and flags them in the physician review queue for explicit acknowledgment.
Longitudinal delta analysis. A result in isolation is a data point. A result in sequence is a signal. When Priya's HbA1c is 6.1% today and her historical record shows 5.7% six months ago and 5.4% twelve months ago, the AI flags not just the current value but the velocity of change — 0.35 percentage points per six months, which projects to HbA1c of 6.5% (the Type 2 diabetes diagnostic threshold) within nine to twelve months if the trajectory continues. This is not a diagnosis. It is a clinical signal that the physician now has explicit visibility into, rather than having to manually pull the trend from the chart during a busy clinic session.
Why Pattern Recognition Changes the Game
A physician reviewing a standard lab report sees a column of values and a column of reference ranges. The mental work of connecting those values into clinical patterns — while simultaneously managing a full patient load — is exactly where things get missed. The AI panel intelligence layer does not replace clinical judgment. It presents patterns explicitly so the physician's judgment can be applied to the synthesis, not the extraction.
In our pilot cohort, pattern-flagged multi-analyte findings led to care plan modifications in 23% of cases where no individual analyte was flagged as abnormal by the lab's own reference ranges.
Stage 4: The Clinical Safety Layer and Physician Review
Every AI insight generated by Stage 3 enters a physician review queue before it is seen by the patient. This is not a formality. It is the architectural commitment that distinguishes clinical-grade AI from a wellness app.
Results are prioritized into three queues. Critical: values that require same-day clinical response — potassium above 5.5 mEq/L or below 3.0 mEq/L, hemoglobin below 7 g/dL, glucose above 400 mg/dL or below 50 mg/dL, creatinine doubling from prior baseline. Critical results trigger an immediate notification to the patient's care team, including on-call coverage if the ordering physician is unavailable. Urgent: results with clinically significant abnormalities requiring provider review within 24 hours. Routine: results cleared in the next available provider session, typically within 4–8 hours during weekday clinic hours.
The physician review interface is deliberately compact. Rather than presenting the full DiagnosticReport (which a physician can access with one tap), the default view shows a "delta dashboard": what changed since the last panel, what the AI flagged and why, and the proposed plain-language patient summary. The physician can accept the AI summary with a single approval, modify any element before approving, add a personalized note (typed or voice-dictated), modify the urgency classification, or — if something is clinically wrong — reject the insight and generate a manual note.
In our pilot data, physicians modified AI-generated summaries in 18% of cases before approving them. The most common modifications: adding clinical nuance to borderline results ("your TSH is technically normal but slightly elevated for your age — something we'll watch"), correcting a tone that was either too alarming or too casual for the specific patient, and adjusting follow-up timing based on patient context the AI didn't have access to.
Critical Values Never Wait
For values in the critical queue, the system does not wait for a physician to log into the review interface. A direct page, SMS, and in-app notification goes to the patient's care team simultaneously. If no acknowledgment occurs within 30 minutes, the on-call escalation path activates. The patient is not notified of a critical result without direct physician-to-patient communication — not through the app's automated delivery channel.
This is a deliberate design constraint. The efficiency gains of automation stop at the threshold of clinical urgency. Some communications should never be automated.
Stage 5: Last-Mile Patient Delivery
Once the physician approves, the patient notification fires within 60 seconds. What the patient sees is not the FHIR data. It is a translated clinical experience designed from the ground up around patient comprehension, not data fidelity.
Each analyte is presented as a named card (not a LOINC code), with the result value, a color indicator (green/yellow/red), a one-sentence plain-language interpretation calibrated to a 7th-grade reading level, and — where available — a trend arrow showing change from the previous panel. Flagged results are listed first. Normal results are collapsed into a summary ("All other 8 results within normal range — tap to expand").
Below the results: the physician's personal note, pre-populated follow-up appointment details, and any action items (dietary changes, new medication instructions, referral bookings). A secure message thread is open directly to the care team for patient questions. In our pilot cohort, 31% of patients sent a follow-up message within two hours of receiving results — not because something was wrong, but because for the first time, they understood their results well enough to have questions about them. That level of engagement is a clinical outcome in itself.
What "Insight" Actually Means
The word "insight" is doing a lot of work in our product name. It is worth being precise about what it means — and what it does not mean.
A result is a measurement: HbA1c: 6.1%.
A reference-flagged result adds context: HbA1c: 6.1% (Reference: 4.0–5.6%). HIGH.
An insight is none of those. An insight is: Your HbA1c has risen from 5.7% six months ago to 6.1% today. This trend suggests your blood sugar regulation is under increasing strain — not yet at a level requiring medication, but at a point where lifestyle changes make a significant difference. Your doctor has already scheduled a follow-up, and your care plan includes three specific dietary recommendations that research shows can reverse pre-diabetic trajectories in the majority of cases.
The components of a true insight are: context (what does this number mean in general?), trend (is this better or worse than before?), clinical significance (what does this mean for my specific health right now?), and actionability (what should I do, and when?). Generating all four components accurately — without clinical errors, without the overstatement that triggers unnecessary anxiety, and without the understatement that breeds false reassurance — is the core engineering and clinical challenge of the AI analysis layer.
We do not claim our AI generates diagnoses. It generates structured clinical observations that a physician interprets, modifies, and approves. The insight the patient reads has been shaped by both algorithmic pattern recognition and physician judgment. That hybrid provenance is not a limitation — it is the point.
Where Standard Reference Ranges Lie
One of the quieter decisions in our AI intelligence layer has outsized clinical consequences: the choice to use population-adjusted reference ranges rather than the single default range printed on most lab reports.
Standard lab reference ranges are derived from reference populations — typically large cohorts of healthy adults in North American or European studies. When those ranges are applied uncritically to South Asian patients, systematic errors compound:
- Hemoglobin: The WHO defines anemia in women as hemoglobin below 12.0 g/dL. South Asian women have documented lower average hemoglobin levels than women in Western reference populations — a hemoglobin of 11.4 g/dL in a healthy, non-symptomatic Indian woman may represent her physiological normal rather than mild anemia. Applying Western thresholds triggers unnecessary anemia workups at significant patient cost and anxiety.
- Vitamin D: Standard "sufficient" thresholds are 30 ng/mL or higher. Published prevalence data from Indian urban populations shows 70–90% of adults fall below this threshold — including, seemingly, perfectly healthy people who spend time outdoors. The threshold itself was established primarily from studies of northern Europeans. Our reference adjustment flags severe deficiency (<10 ng/mL) as urgent and moderate deficiency (10–20 ng/mL) for clinical review, but does not catastrophize a result of 22 ng/mL for a South Asian patient the way a raw comparison to the Western sufficiency cutoff would.
- BMI thresholds: Standard BMI categories define overweight as 25–29.9 and obese as ≥30. The WHO Expert Consultation published in 2004 established revised BMI action points for Asian populations: overweight begins at 23, and obesity at 27.5. South Asian individuals develop metabolic complications (insulin resistance, cardiovascular risk) at lower BMI values than European counterparts. When our pipeline includes BMI in the context of an HbA1c or lipid panel result, it uses population-appropriate thresholds.
- GFR estimation: The MDRD equation used for decades to estimate glomerular filtration rate (eGFR) included a race multiplier for African American patients that has been removed in the 2021 CKD-EPI equation — correctly, because race is a social construct, not a biological constant. We use CKD-EPI 2021 exclusively. Any system still applying the race coefficient is introducing systematic bias into kidney function assessment.
Importantly, we never silently override the lab's reference range. The lab's range is always visible in the expanded result view. Our adjusted threshold — where applied — is shown alongside it, with a brief note explaining the adjustment: "LivoRx uses age- and population-adjusted reference ranges. The lab's reference range for this test is [X–Y]. We apply [Z] for your demographic profile." The physician always sees both and can override our adjustment for any individual patient.
The Time Math: Where the 24 Hours Go
The "under 24 hours" claim is not a marketing approximation. Here is where the time actually goes, based on production data from our platform:
| Phase | What Happens | Typical Duration |
|---|---|---|
| Order dispatch | FHIR ServiceRequest generated and transmitted to lab network | <5 min |
| Sample collection | Patient travels to collection center, blood draw | 0–2 hrs |
| Lab processing | Automated analyzer processes sample; results released by lab | 2–6 hrs |
| Ingestion & normalization | FHIR/HL7 ingestion, unit conversion, LOINC canonical mapping | <30 sec |
| AI panel analysis | Individual flags, pattern recognition, longitudinal delta analysis | <2 min |
| Physician review | Compact delta dashboard review and approval (or modification) | 2–8 hrs |
| Patient delivery | Push notification, app result view populated with insight | <60 sec |
| Total (routine panel, morning collection) | Blood draw to patient insight in hand | <24 hrs |
The bottleneck is not the AI analysis — that completes in under two minutes. The bottleneck is physician review, and deliberately so. Routine results reach the physician review queue during the same-day clinic session. The median physician review time in our current workflow is 4.2 hours for weekday results — measured from AI analysis completion to physician approval. That 4.2 hours is the human judgment layer. We could technically route most results to the patient faster if we bypassed physician review. We do not, because the 4.2 hours is not overhead — it is the product.
What Changes for the Patient
The experience transformation is difficult to quantify but easy to feel when you compare it directly. Here is what the same lab panel looked like for Priya before she joined LivoRx, when she used the patient portal at a traditional clinic network:
Blood draw on Monday morning. Portal notification on Wednesday afternoon: "Your results are available." She logs in to a PDF. Fourteen rows. Reference ranges printed in tiny font. HbA1c: 6.1% H. The "H" means high. She Googles "HbA1c 6.1." The search results include: "You might have pre-diabetes," "What happens if HbA1c is 6.1?," and an ad for a continuous glucose monitor. She reads four articles, each with contradictory messaging. She calls the clinic. The nurse says the doctor will call back. The doctor calls Thursday at 5 PM. By then, Priya has spent 36 hours in a state of calibrated dread, researching a condition she does not yet have, that requires lifestyle modification rather than medication, and that is entirely manageable with the right support.
A 2019 study in Patient Education and Counseling documented precisely this pattern: patients who received abnormal lab results without same-day contextualization showed significantly higher anxiety scores, lower comprehension of their result's clinical significance, and — critically — lower adherence to recommended follow-up at 90 days. The anxiety is not a personality quirk. It is a predictable response to being handed data without meaning in a context where meaning matters enormously.
The same-day, plain-language, physician-reviewed insight does not eliminate the emotional weight of an abnormal result. Priya's HbA1c is still 6.1%. That reality does not change. What changes is the cognitive frame around it: she understands what it means, she understands what it does not mean, she knows what to do next, and she knows her care team has already reviewed it and believes she is going to be okay. That frame is the difference between informed health engagement and generalized health anxiety.
Five Things We Learned Building This
Building a production lab intelligence pipeline taught us things that don't appear in HL7 specifications or FHIR implementation guides.
- LOINC codes are essential, imperfect, and politically complex. HbA1c alone has eight active LOINC codes, depending on specimen type, method, and reporting convention. Our normalization layer maintains a mapping table of 450+ lab-specific code variants to their canonical LOINC representations, updated each quarter as lab partners release LIS software updates. The first three months of building this were largely spent arguing about LOINC codes with lab integration engineers. That argument was the foundation of everything that works today.
- Physician review latency is the design constraint, not the technical constraint. The AI analysis pipeline completes in under two minutes. The physician review takes hours. Rather than trying to eliminate physician review time, we designed around it: the review interface compresses the cognitive load so a physician can review and approve a routine panel in under 90 seconds when results are genuinely unremarkable. Time goes into the cases that warrant it. The interface makes it obvious which cases those are.
- Alert fatigue is a system design failure, not a physician behavior failure. Our first version of the urgency classification system flagged too many results as urgent. Physicians began processing the urgent queue the same way they processed the routine queue. We recalibrated: critical values (truly requiring same-day response) are now less than 3% of results. The urgent queue carries only results that a physician would genuinely want to know about before they next see the patient. The routine queue is everything else. The recalibration was humbling — it required acknowledging that we had created alert fatigue and committing to eliminate it.
- Reference range adjustments require clinical partnerships, not just data science. The population-specific reference range adjustments described earlier are not arbitrary. Each adjustment is sourced from peer-reviewed population studies, reviewed by our clinical advisory board, documented with citations, and surfaced transparently to the physician. We do not make reference range adjustments because we believe we know better than the lab. We make them because the evidence base for population-specific thresholds exists, is underutilized in standard lab reporting, and has documented clinical impact on diagnosis equity.
- Patient comprehension is more variable than any UX audit reveals. We designed our plain-language result summaries targeting a 7th-grade reading level, validated them with a patient panel, and were confident. Pilot data showed that 31% of patients sent follow-up messages about their results — which was higher than expected and revealed something important: comprehension at 7th grade reading level still leaves a large comprehension gap for patients with lower health literacy, or patients who speak English as a second language, or patients who are simply very anxious. We now offer result summaries in Hindi, Tamil, and Telugu alongside English, and we are building adaptive literacy calibration based on patient reading behavior patterns in the app.
The Horizon: Longitudinal Lab Intelligence
The full-loop architecture described in this piece closes the immediate gap: from blood draw to insight in under 24 hours. But closing the immediate gap is not the same as solving the longitudinal problem — the slow, silent shifts in a patient's lab values over months and years that individually look unremarkable and collectively represent a health trajectory that is entirely preventable.
Consider the HbA1c progression: 5.4% at age 32, 5.7% at 33, 6.1% at 35. At 5.4%, there is nothing to flag. At 5.7%, a conscientious physician might note a slight uptick. At 6.1%, the pre-diabetic classification activates and the intervention begins. But if we had connected all three points into a linear trend at age 32, the slope would have been visible eighteen months before the clinical threshold was crossed. The intervention — the dietary adjustment, the exercise recommendation, the glucometer check — would have been easier, cheaper, and more effective earlier in the trajectory.
Longitudinal lab intelligence requires solving three hard problems that we are actively working on:
- FHIR longitudinal storage with patient consent controls. A patient must be able to see exactly what historical data the system is analyzing, request correction of erroneous records, and opt out of longitudinal analysis entirely while still receiving real-time results. The infrastructure is FHIR-native — longitudinal analysis operates on the same Observation bundle architecture as real-time analysis, just with a time window extending months or years rather than the current visit.
- Population cohort benchmarking. A 38-year-old South Asian woman's lipid panel tells a richer story when compared to the distribution for her demographic cohort — not just against an undifferentiated adult reference range. Building population-stratified cohort distributions from our consented patient data while preserving individual privacy requires differential privacy techniques that we are implementing in collaboration with our data science and legal teams.
- Predictive signal calibration. The goal of longitudinal intelligence is not to predict disease — it is to identify modifiable trends early enough for intervention to matter. We are calibrating prediction models to generate signals when trend-based intervention has the highest expected impact, not simply when statistical significance thresholds are crossed. Clinical utility, not statistical novelty, is the benchmark.
The 24-hour insight loop we built today is the foundation. Each result that runs through it adds a point to the longitudinal record. Each pattern we identify and surface gets sharper as the record deepens. The patient Priya encounters today — the one who gets her HbA1c result contextualized and explained on the same day — becomes, over years of care, a patient whose entire health trajectory is legible to her care team in a way that was never possible when results were siloed, delayed, and delivered as raw numbers.
Lab diagnostics have been a periodic checkpoint for most of medical history. The architecture we are building makes them a continuous signal. That is not a feature. It is a different model of care.
References
- Casalino et al., JAMA (2009): "Frequency of Failure to Inform Patients of Clinically Significant Outpatient Test Results." 7.1% of physician respondents reported failure to notify patients of at least one abnormal result in the prior two months.
- Singh et al., BMJ Quality & Safety (2021): "Delayed follow-up of test results in primary care: a systematic review." 37% of abnormal results not acknowledged by ordering provider within 7 days across included studies.
- IDF Diabetes Atlas, 10th Edition (2021): India prevalence of type 2 diabetes estimated at 11.4% of adults (77 million individuals affected); South Asian populations exhibit T2DM phenotype at lower BMI thresholds than European populations.
- Ritu G and Gupta A, Journal of Postgraduate Medicine (2014): "Vitamin D deficiency in India: prevalence, causalities and interventions." Prevalence of deficiency (<20 ng/mL) estimated at 70–90% in South Asian urban populations.
- WHO Expert Consultation (2004): "Appropriate body-mass index for Asian populations and its implications for policy and intervention strategies." Published in The Lancet. Established revised BMI action points: overweight at BMI ≥23, obese at ≥27.5 for Asian populations.
- Inker et al., New England Journal of Medicine (2021): "New Creatinine- and Cystatin C–Based Equations to Estimate GFR without Race." CKD-EPI 2021 equation removes race coefficient from GFR estimation.
- Divi et al., Patient Education and Counseling (2019): Patient anxiety and comprehension outcomes associated with timeliness of diagnostic result communication in primary care settings.
- Ancker et al., Journal of the American Medical Informatics Association (2017): Patient engagement with laboratory results in patient portals — comprehension rates and action taken stratified by result contextualization level.
- HL7 International: FHIR R5 DiagnosticReport and Observation resource specifications. HL7 v2.5 ORU^R01 and ORM^O01 messaging standards.
- LOINC (Logical Observation Identifiers Names and Codes), Regenstrief Institute: Laboratory observation coding system. LOINC code 4548-4 (Hemoglobin A1c), LOINC 58410-2 (CBC panel).